
Your Ultimate Guide To Modern KPI Reports In The Digital Age – Examples & Templates
 Experts predict that by 2025, around 175 Zettabytes of data will be generated annually, according to research from Seagate. Moreover, within just five years, the number of smart connected devices in the world will amount to more than 22 billion – all of which will produce colossal sets of collectible, curatable, and analyzable data, claimed IoT Analytics in their industry report.
What does this mean? Essentially, it means that we are living in a world rich with data, and for businesses looking to streamline their processes, monitor various areas of performance, and understand their customer base on a deeper, more personal level, collecting, analyzing, and leveraging this wealth of insights is critical for success.
But with so much data available from an ever-growing range of sources, how do you make sense of this information – and how do you extract value from it? One of the most effective means of doing this is by utilizing KPI reporting tools.
Looking for a bite-sized introduction to reporting? Get our free guide!
Here, we’ll explain the KPI data and reporting in greater detail, ask the question ‘what is KPI reporting,’ look at how to create a KPI report, and explore the dynamics of a KPI report template.
Let’s start by considering what KPIs are and what they mean in a business context.
What Is A KPI?
KPI is a value measured to assess how effective a project or company is at achieving its business objectives. In other words, KPIs provide organizations with the means of measuring how various aspects of the business are performing in relation to their strategic goals.
On a fundamental level, KPIs provide critical performance-based information that enables an organization, and its stakeholders, to understand whether or not it’s on track and thus take action accordingly. Whether utilizing HR KPIs or any other department and industry, it is crucial to understand these basic definitions so that the creation and analysis can improve a company’s bottom line.
What Is A KPI Report?
A KPI report is a medium that facilitates the measurement, organization, analysis, and study of your most important business KPIs over specific periods. Doing so will help you to identify potential strengths, weaknesses, trends, and possible areas for improvement.
Typically presented in the form of an interactive dashboard, this kind of report provides a visual representation of the data associated with your predetermined set of key performance indicators – or KPI data, for short.
A KPI dashboard presents critical insights in a logical, digestible format that makes it easy to extract important information and act upon it retrospectively, as well as in real-time. Fundamentally, this kind of report is a strategic tracking method that will provide a window to your business’s most essential activities.
Why Are KPI Reports Important?
As mentioned, we are living in data-driven times, and to win on today’s commercial battlefield, making informed decisions based on digital insights (KPI data) is a must if you want to thrive today, tomorrow, and long into the future.
KPI reports are important as they empower businesses to set meaningful goals and benchmarks, the kind of which that will help them improve, evolve, scale, and become more adaptable in an ever-changing digital landscape.
By setting and measuring KPIs and customizing them through a report, you will gain a wealth of insights into your business, from customer behaviors to financial inefficienciesand content performance.
All of these elements, when organized in intuitive and visual reporting dashboards, will not only allow you to spot patterns as they unfold but drill down into historical data and make the strategic tweaks and changes that can ultimately make or break your business.
How Do I Prepare A KPI Report?
We’ve covered key performance indicators in addition to the power and importance of these kinds of reports. Now, let’s look at how to create a KPI report.
These reports are interactive, dynamic, and tailored to the individual user, department, or organization depending on their operational needs, strategies, aims, goals, and objectives. They are customizable and thus offer a powerful means of drilling down deep into very specific pockets of information. Picture procurement metrics – you need to know if suppliers fulfill your demands, their capacity to respond to urgent demands, costs of orders, and many other indicators to efficiently track your company’s performance. But you need to know what to consider when preparing your report.
When considering how to prepare a KPI report – and indeed, how to create a KPI report – it’s important to understand that for optimum success, you must follow a process.
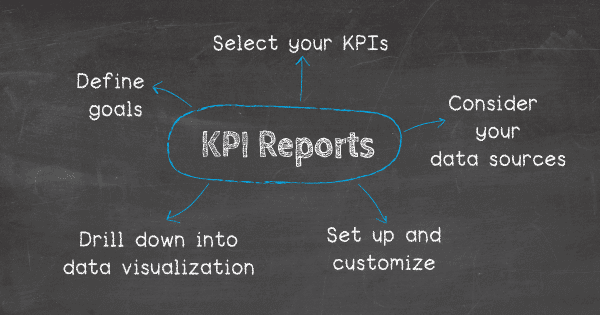
To help you understand how to write a KPI report the right way, we’re going to run through our 5-step KPI reporting creation process.
Before we continue, here’s a quick summary of essential elements to cover when building your KPI report:
- Define with various stakeholders your strategic business goals.
- Pick a couple of indicators that will track and assess the performance.
- Consider your data sources.
- Set up a report which you can visualize with an online dashboard.
- Don’t get confused about the types of data visualization you choose.
Now, to help you on your path to data-driven enlightenment, here’s a more detailed rundown on how to prepare a KPI report, touching on key elements detailed in the summary above:
1) Define your business aims & goals
Every business, depending on its size, sector, and core objectives will have its own set of KPIs dedicated to different disciplines within the organization. To understand which KPIs will prove to be the most valuable to your business, you should sit down with key stakeholders and discuss your business aims, goals, and objectives in an open collaborative environment.
In doing so, you’ll gain a panoramic perspective of where to aim your efforts as well as the metrics and insights that are worth measuring for success. This will form the foundations of your ultimate KPI reporting success.
2) Select your KPIs
Once you’ve defined all of your organization’s most critical goals, the next stage in your reporting journey will be selecting the key performance indicators you want to work with according to your ongoing initiatives and strategies.
Fortunately, in the digital age, a wealth of invaluable KPIs exist to assist growth in a number of areas from marketing and accounts to customer service, fulfillment, and beyond.
Here, you can find different lists of KPI examples classified according to their function and industry, which helps in narrowing down and selecting the most critical ones you need. Also, explore our guide to KPI management and learn from a host of helpful best practices.
3) Consider your data sources
The next stage in the ‘how to create a KPI report’ process boils down to taking a detailed look at your data sources.
Today’s KPI report template dashboards consolidate all of your data, with the help of data connectors, from various platforms or sources, working with your assigned KPIs to deliver the insights you need for growth, improvement, and sustainable success. As such, performing an audit of your data sources is essential.
Before physically creating your data dashboard, you should consider which data sources align with your business objectives and which will best suit your KPIs. Anything that is surplus to the requirement should be disabled or omitted from use.
By doing this, you’ll streamline your efforts and ensure that your KPI reporting dashboard only serves up the information or insights worth analyzing. In practice, for example, that means that accounting reports should correspond with specific financial data you need to generate insights from.
Looking for a bite-sized introduction to reporting? Get our free guide!
4) Set up and customize your report
Once you have decided which KPIs you’d like to work with and examined your key data sources, you’ll be ready to set up a report and customize it to your requirements.
The most effective way to collate and manage your performance indicator is through a KPI software as it will empower you to create comprehensive summary reports from various metrics and visualize them through powerful dashboards. Of all the available data visualization mediums, the dashboard is the most effective, efficient, and easy to navigate format.
Moreover, once you’ve set up user access, your reports, your key performance indicators, and tailored the look, feel, and functionality of your reports to your preferences, you’ll be able to gain swift 24/7 access to your most valuable data through the medium of desktop, tablet, or smartphone.
To help you with your creation and customization efforts, here’s a comprehensive guide to data dashboard design principles for your reading pleasure.
5) Drill down into data visualization
Data visualization is a powerful concept and one that is pivotal to reports of any shape or size. Through data visualization, you can extract value from your most important data at a glance, tell a story with your metrics or insights, and share critical information with others inside or outside your organization in a way that is digestible as well as inspirational.
Once your reports are up and running, it’s important to monitor regularly and make tweaks or improvements to your reporting efforts as required.
Also, our additional post on how to make a dashboard will help you take your decision-making to the next level offers a wealth of information on crafting, developing, and presenting your company’s reports.
KPI Reports Examples And Templates
We’ve looked at how to prepare a KPI report as well as how to write a KPI report. Now, to illustrate the power of KPI reporting, here are 6 hand-picked KPI reports examples that are specific to three of the most critical areas of any modern business: financial, management, and sales.
1. Financial profit and loss dashboard
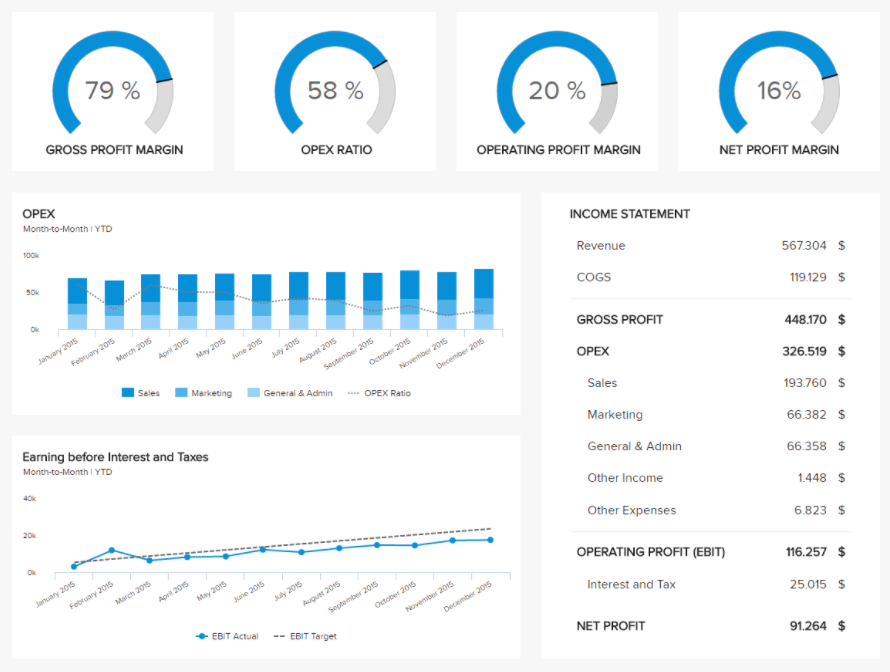
The first of our KPI reports examples is financial. Profit and loss are the two most essential factors in any organization’s bottom line. This particular financial report example, visualized on a comprehensive financial dashboard, provides a digestible overview of a business’s income statement from revenue to net profit, fortified with appropriate performance ratios.
**click to enlarge**
The financial loss and profit dashboard hones in on gross profit margin, OPEX ratio, operating profit margin, and net profit margin, offering a host of bespoke information at your fingertips.
By monitoring this financial KPI report on a consistent basis, you’ll gain a panoramic insight into your business’s overall financial performance and be able to take measures in improving areas you deem to be weak while also capitalizing on areas of strength – essential metrics for any business looking to grow their profits over time.
KPIs used:
- Gross Profit Margin Percentage
- Operating Profit Margin Percentage
- Operating Expenses Ratios
- Net Profit Margin Percentage
2. Financial KPI dashboard
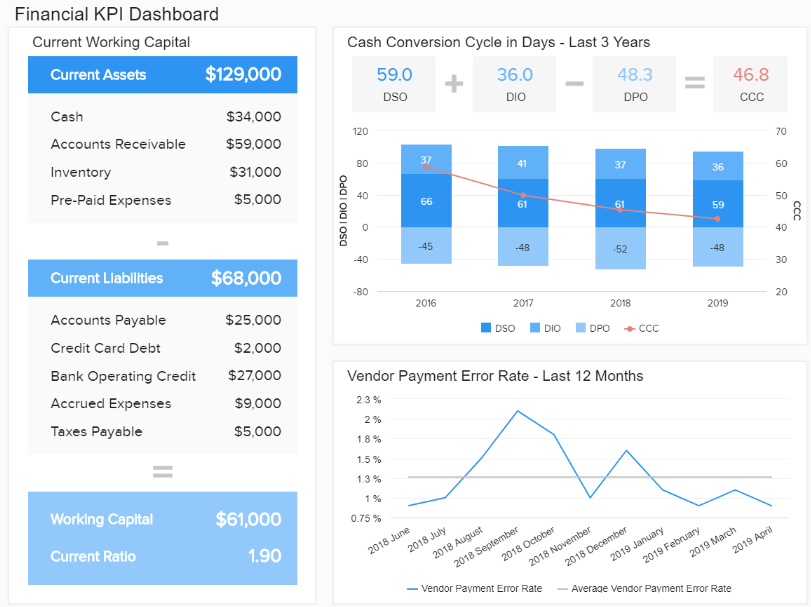
At the heart of every successful modern business lies a cohesive, well managed, and data-driven financial department. Our second financially-based KPI report sample, the financial dashboard offers a comprehensive overview of every area of your organization’s monetary activities, both internal and external.
**click to enlarge**
Powered with cutting-edge financial analytics software, this KPI report template dashboard exists to answer essential questions centered on liquidity, invoicing, budgeting, and the general financial stability of your business.
Broad, balanced, and insightful, this dynamic reporting tool offers the ability to drill down into aspects of your company’s financial health by working with KPIs including working capital, cash conversion cycle, budget variance, and more.
KPIs used:
- Working Capital
- Quick Ratio / Acid Test
- Cash Conversion Cycle
- Vendor Payment Error Rate
- Budget Variance
Looking for a bite-sized introduction to reporting? Get our free guide!
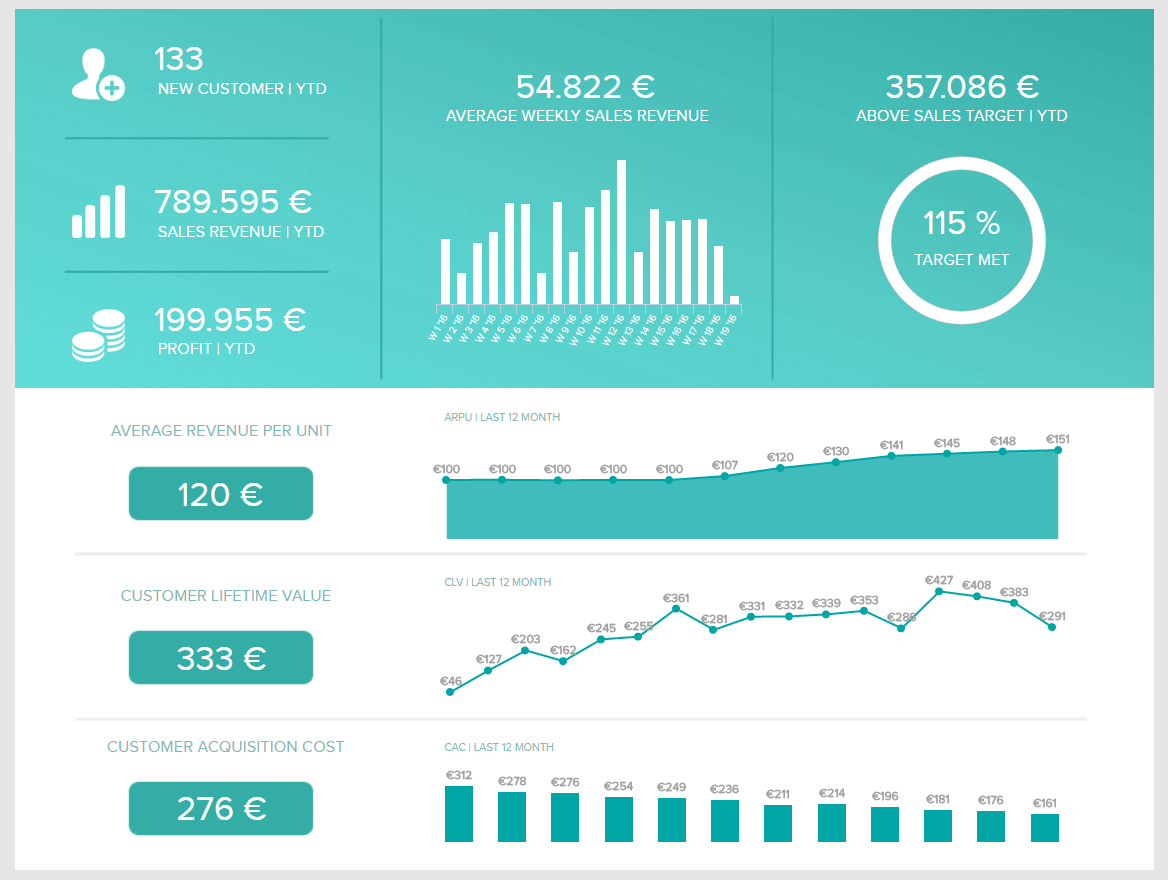
3. Management KPI dashboard
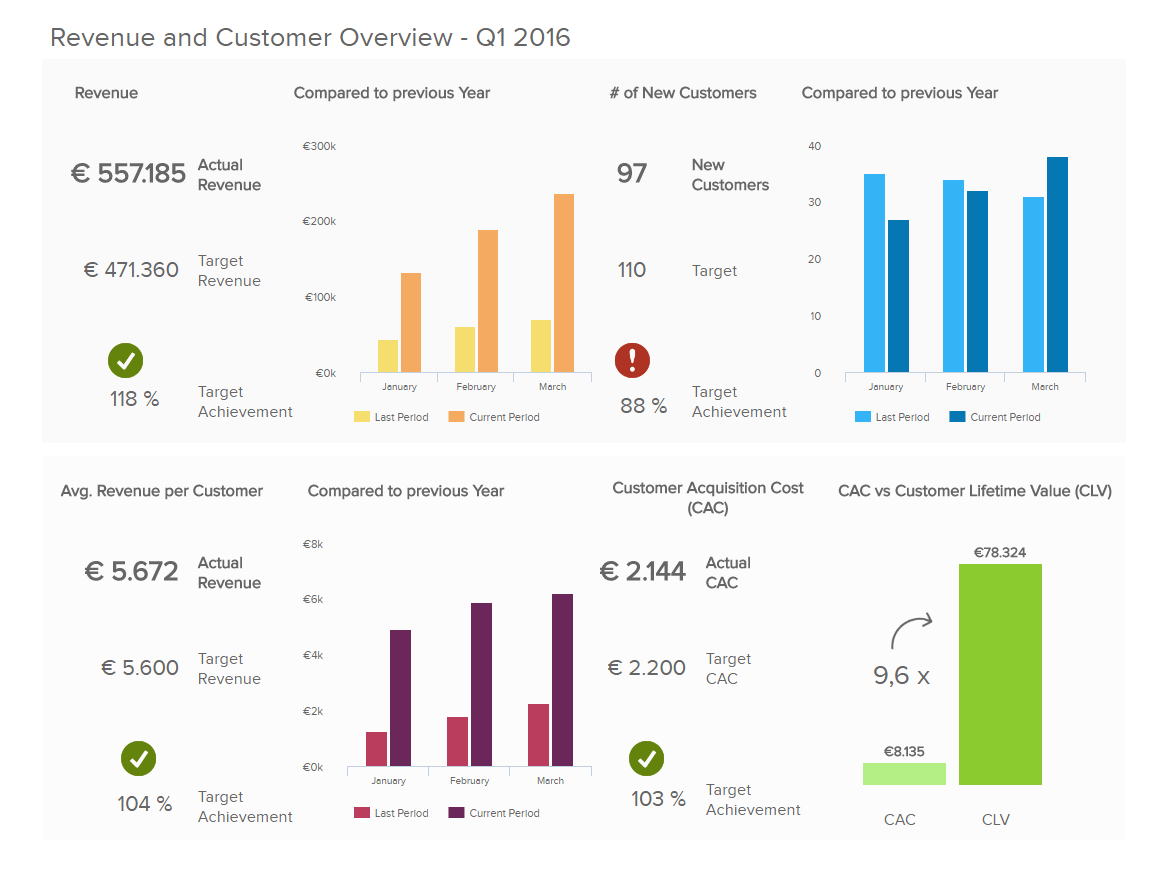
This management-centric KPI dashboard focuses specifically on total revenues in addition to customer-based revenues while providing vital insights that will help you set informed sales targets for your organization.
**click to enlarge**
Offering visual data on customer acquisition costs, customer lifetime value, and sales target information, on this management dashboard, you will be able to make intelligent managerial forecasts, spot trends, and understand where you need to improve processes within the business. A priceless KPI tool for those in senior management roles across a range of sectors and industries.
KPIs used:
- Customer Acquisition Costs
- Customer Lifetime Value
- Sales Target
4. Sales performance dashboard
In the commercial world, sales cover a broad spectrum and to ensure you meet your targets while cementing growth, collecting the right data is essential.
This KPI report example offers an ideal overview of the progress of your sales department, drilling down on sales KPIs such as sales growth, sales targets, ARPU, CAC, and CLV.
**click to enlarge**
By providing a detailed visualization of every aspect of your sales portfolio, this report empowers sales managers to take a full snapshot of their sales operations without losing any data, enabling them to create an extensive sales report.
Here it’s possible to take an overall glance of your sales performance or analyze specific pockets of information to your advantage, increasing metrics like customer lifetime value and average revenue per unit as a result.
KPIs used:
- Sales Growth
- Sales Target
- ARPU
- Acquisition Cost
- CLV
5. Sales conversion dashboard
One of the best ways to grow your business is by increasing your conversion rates. Of course, there are a number of stages to closing a sale, from gaining and nurturing leads to prompting a conversion – and this particular KPI dashboard allows you to look at each critical stage of the process in detail.
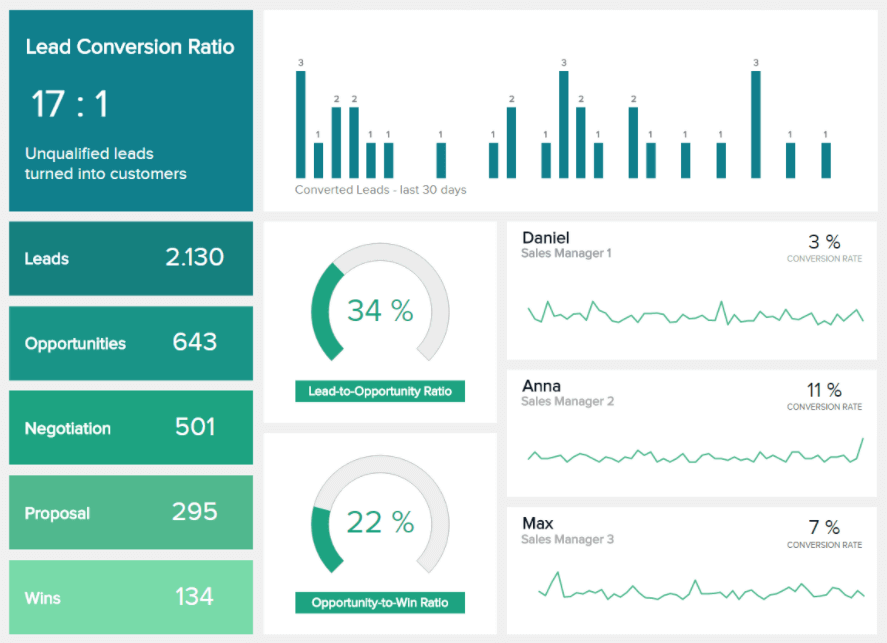
**click to enlarge**
Through a series of comprehensive insights and lead-based data, this KPI report sample will empower you to streamline your sales processes, enhance your sales strategy, and increase your all-important conversion rates as a result, which you can also see in more detail on our sales dashboard template.
KPIs used:
- Lead-to-Opportunity Ratio
- Opportunity-to-Win Ratio
- Lead Conversion Rate
6. SaaS executive dashboard
For SaaS businesses looking to thrive in the digital age, our dedicated KPI dashboard is essential. By focusing on the three most critical areas relevant to any SaaS-based organization at an executive level – customers, recurring revenue, and costs – you’ll be able to foster the continued growth and evolution for ongoing success in your field.
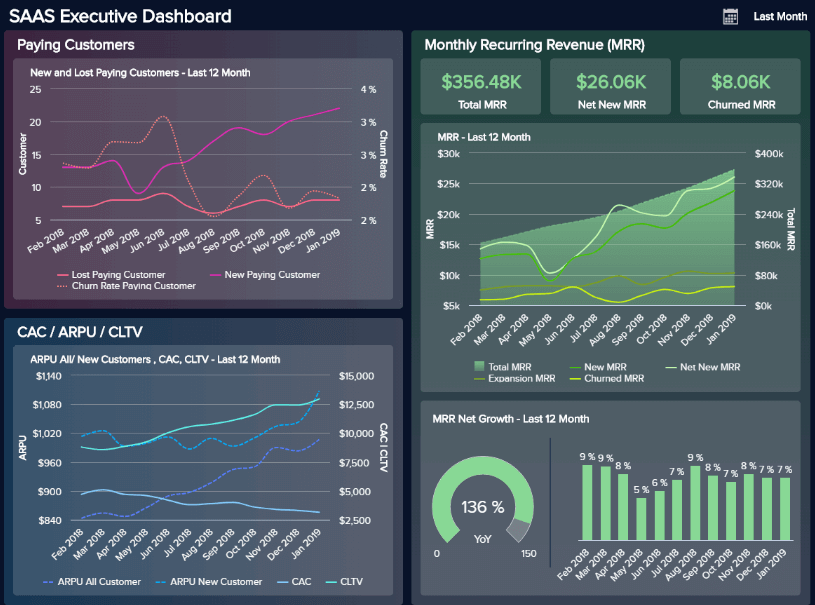
**click to enlarge**
The KPIs included within this KPI reporting example offer a detailed view of each of these key areas. This powerful reporting tool assists in the fluid and proactive management of your SaaS organization as a whole.
From customer acquisition costs to churn rates, lifetime value, and beyond, this digestible dashboard is the go-to tool for SaaS business seniors.
KPIs used:
- Customer Acquisition Costs
- Customer Lifetime Value
- ARPU
- MRR
“Most people use statistics the way a drunkard uses a lamp post, more for support than illumination.” – Mark Twain
Looking for a bite-sized introduction to reporting? Get our free guide!
After asking the question, ‘What is a KPI report,’ understanding how to make a KPI report, and looking at real-world examples, it’s clear that these invaluable tools offer a wealth of insights into critical areas of any business, providing the tools to set viable goals, work towards worthwhile benchmarks, and leverage invaluable information to your advantage. Whether concentrating on manufacturing KPIs or tinkering your logistics analytics, a powerful KPI dashboard will provide a foundation for all your operational and strategic needs and development.
By knowing how to create a KPI report and presenting this information in a logical, visually engaging format, you’ll provide a long-term solution for organizational improvement and growth. When considering ‘what is KPI reporting,’ it’s all about sustainable growth and improvement.